How to turn your logs into valuable metrics and actionable alarms using CloudWatch
Logs are important, we use them a lot while developing, and even more when something goes wrong, but did you know, in AWS, logs can be turned into valuable metrics?
PatternFilter on Cloudwatch Logs
Again we are pretty used to using our logs, we go to CloudWatch logs, find a group, find a stream and then we search, either by date or using a keyword.
But there are smarter ways to search logstreams and they depend on how your logs looks. For example:
[INFO] 2018–11–19 15:38:51 [finagle/netty4–6] c.t.f.h.filters.AccessLoggingFilter — 172.17.19.148 — — [19/Nov/2018:15:38:51 +0000] “GET /app/health HTTP/1.1” 200 2 0 “Consul Health Check”[INFO] 2018–11–19 15:39:01 [finagle/netty4–7] c.t.f.h.filters.AccessLoggingFilter — 172.17.19.148 — — [19/Nov/2018:15:39:01 +0000] “GET /app/health HTTP/1.1” 200 2 0 “Consul Health Check”[INFO] 2018–11–19 15:39:11 [finagle/netty4–8] c.t.f.h.filters.AccessLoggingFilter — 172.17.19.148 — — [19/Nov/2018:15:39:11 +0000] “GET /app/health HTTP/1.1” 200 2 0 “Consul Health Check”[INFO] 2018–11–19 15:39:21 [finagle/netty4–1] c.t.f.h.filters.AccessLoggingFilter — 172.17.19.148 — — [19/Nov/2018:15:39:21 +0000] “GET /app/health HTTP/1.1” 200 2 0 “Consul Health Check”Here you can see a fraction of an apps log, it’s not ideal, but at least it has some structure, that structure is this:
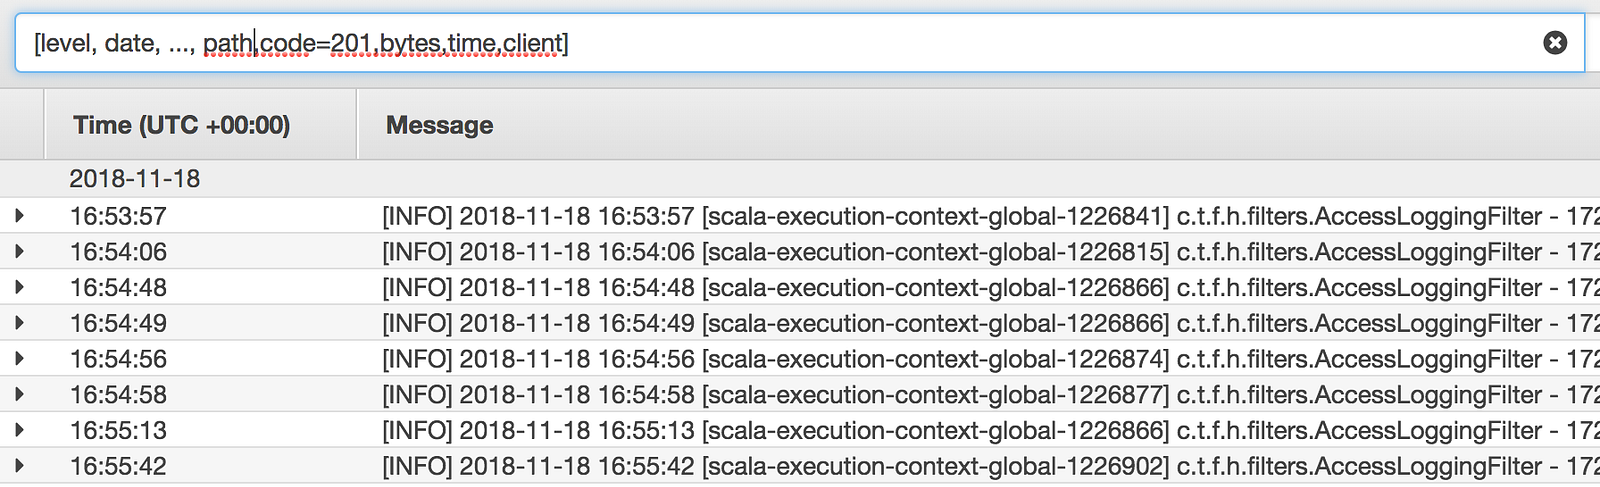
[level, date, .. stuff .., path, code, bytes, time, client]For our use case, there is stuff we don’t really care about, there is a way to address that in our pattern, in this case, we filter using this
[level, date, …, path, code=200, bytes, time, client]The three points column means stuff I don’t care, then you can filter per columns value like above, we are filtering only HTTP 200s responses, but we could filter by client, or by endpoint path, or any combination.
So your first job in getting this setup would be to do a structured logging and identify ways to filter what you need.
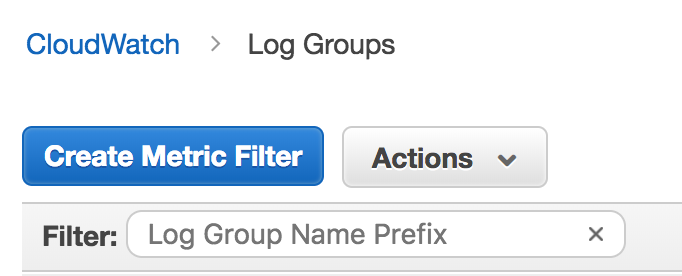
Add Metrics Filter
Once you have identified a way to filter what you need, we need to set up a metric filter, here’s how we do that
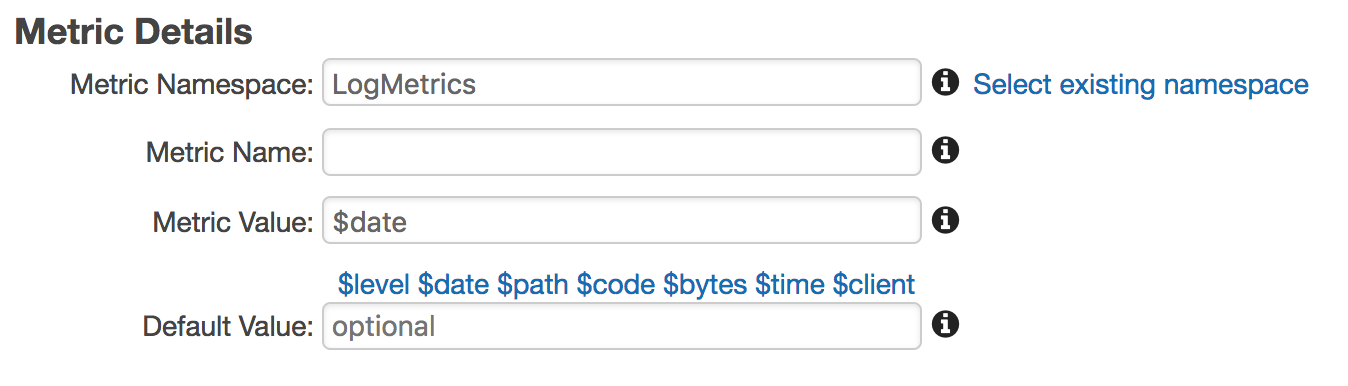
Now you have a filter on your logs, but until it detects something you won’t see it on CloudWatch Metrics. These filters don’t look back, so keep that in mind when creating or modifying them.
After a while, you can go check which CloudWatch Metrics and see your beautiful Metric (they fall under the Metrics with no dimensions)
If you have your logs on CloudWatch and you don't actually need dimensions, you don't need to look for scripts or libraries to push metrics into CloudWatch anymore!
Add Alarms
After you have your metric you can create an alarm based on it just like any other AWS service!